U.S. Economic and Market Highlights
THE ECONOMY
- Recent U.S. jobs report showed the economy added 339,000 jobs in May, well above the 195,000 consensus expectation. Upward revisions the past two months underscore the strength of job creation in the U.S. The May unemployment rate was 3.7%.
- U.S. wage rate increases decreased to a 4.3% annually along with CPI which continues to trend downward to 4.9% in April, slightly below the expectation of 5%.
- The result of the debt ceiling deal in the U.S. is the avoidance of significant risks to financial markets, jobs, and economic growth if there had been a U.S. default. U.S. Lawmakers agreed to suspend the nation’s debt limit and put caps on federal spending for two years.
- The Fed could potentially ‘skip’ a rate hike at the June meeting and leave the door open for a July increase. This strategy provides the Fed flexibility to determine its next move based on the data as the key determinant.
- German industrial production declined so far in 2023 with manufacturing down the most and some service sector improvement. Germany experienced zero growth in Q1, while France, Italy, and Spain reported increased output.
- Recent Eurozone economic data show a slowing economic growth rate as higher interest rates filter through the economy to slow borrowing and investments. Additional constraints on growth are the ongoing war in Ukraine, demographic changes, and the current energy transition.
- Even though underlying consumer prices (inflation) in the Eurozone increased 5.3% in April, below expectations of 5.5%, the European Central Bank (ECB) plans to continue to raise rates during the summer.
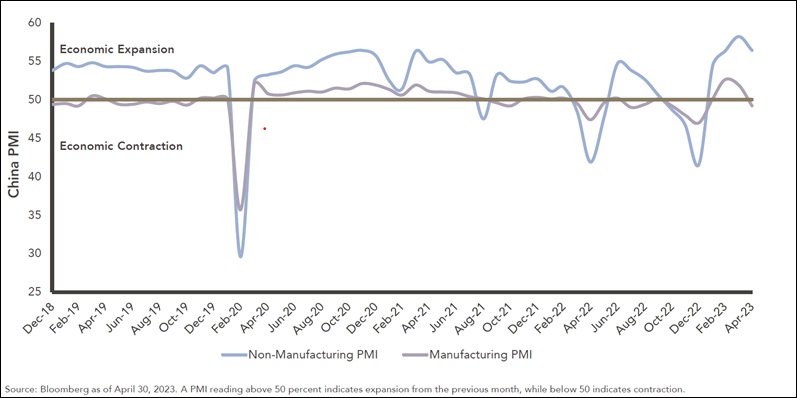
- China gained some momentum in Q1 but market demand cooled in April, causing a reversal in the Purchasing Managers Index (PMI) in particular manufacturing (see chart below). China was once again Germany’s largest trading partner for goods in 2022 and views Germany both economically and politically as a key partner in Europe.
- Purchasing Managers Index (PMI) for China.
FIXED INCOME
- Interest rates rose in May on the 10-Year U.S. Treasury bond ending the month above 3.60% as the debt ceiling negotiations drove investor sentiment.
- Higher interest rates and recession fears from a slowing economy have driven investors into fixed income funds at a pace that is 2.5 times higher than inflows into equity funds.
- High quality and investment-grade bonds offer some protection against recession risk and volatile markets, while high yield or junk bonds could be negatively affected by a weaker economy. Government bonds are most sensitive to interest rate changes. Investors are most interested in shorter-term bonds because interest rates are higher on the short end of the yield curve and more likely to drop in a recessionary environment.
- High yield loan defaults increased from record lows last year and are projected to move higher as the economy slows. As of March 31, default rates rose to 2.1% from 1.1% last year. The long-term average default rate for high yield bonds is 3.6%
EQUITIES
- The S&P 500 index gained 20% since the October 12, 2022 market low. The index has been in bear-market territory for 244 trading days, the longest run since the one that ended May 15, 1948, which lasted 484 days. Historically, the average bear market has lasted 142 trading days.
- Each company in the S&P 500 index is weighted differently based on their respective market capitalization (size). A substantial portion of the total returns in the index are driven by a handful of large-cap technology companies. (Meta, Amazon, Apple, Microsoft, and Alphabet together make up >20% of the S&P 500 index.) Without the outperformance of growth stocks in Q1, S&P 500 returns would have been in the low single digits year-to-date.
- The broader equity market rebounded toward the end of May on the following positive news: U.S. avoids a debt ceiling default, concerns about a banking crisis are reduced, lower inflation report, strong jobs’ data report, and possible Fed interest rate pause in June.
- Developed international stocks (as measured by MSCI EAFE) outpaced the S&P 500 year-to-date (see below).
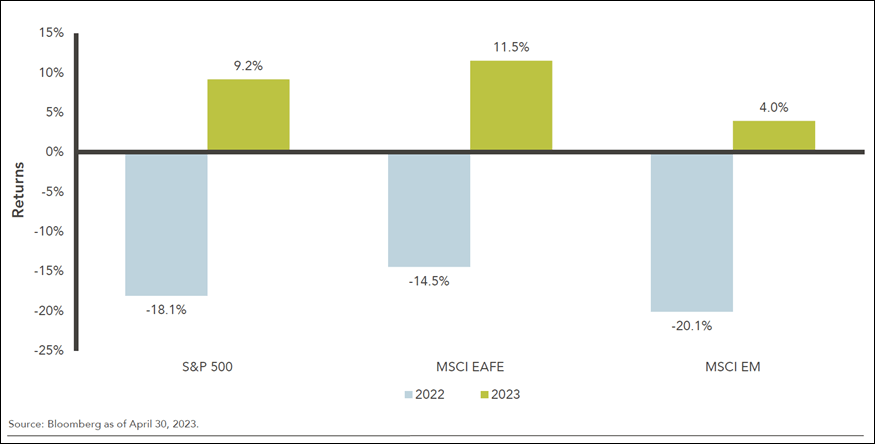
- Non-U.S. equities have significantly underperformed U.S. stocks over the past decade. But long-term (over the last 53 years), non-U.S. equity markets have performed on par with U.S. equity markets. The above chart only shows a short-term period of outperformance by Non-U.S. equities. The benefits of global equity diversification still exists even though the correlation between non-U.S. and U.S. equity indices has risen from 0.49 in 1989 to 0.87 in 2022.
This communication was prepared for informational purposes only and is not an offer to buy or sell or a solicitation of an offer to buy or sell any security/instrument or to participate in any trading strategy. Past performance is not indicative of future results. See below reference sources used in preparing the above information.