U.S. Economic and Market Highlights
The Economy
- There is a mismatch between labor supply and demand that is driving up wages and delaying full economic recovery. Many employers are realizing the need to raise wages to increase the number of qualified candidates to fill jobs needed to support business growth moving forward.
- New jobs reported in August in the U.S. were only one-third of the total estimated by the Department of Labor, which is the lowest level since January in what has otherwise been a robust recovery.
- The housing boom is probably not a bubble, like the mid-2000’s, because the quality of mortgage underwriting has improved and the balance sheets of individual households on average and banks have improved since then.
- Consumer sentiment edged upward in late September. A volatile recovery may lie ahead for the retail sector for the rest of the year as consumers gravitate to pre-pandemic spending habits and the seasonal effects from the pandemic subside.
- Bloomberg composite of 80 investment bank forecasts are now projecting GDP to be above the trend of what would have happened if COVID did not.
- Inflation rose sharply with rising costs of goods and services in August and September. The inflation rate in the U.S. inflation and in Europe is at multi-year highs, with all signs pointing to price pressures will remain into next year. Much is attributed to backup supply chains and higher costs of transport due to higher energy prices.
- Annual wage gains in household incomes are below current inflation rates. Expectations for real wage gains (income after adjusting for inflation) have fallen to the lowest levels since February 2015.
Fixed Income
- The Fed signaled a likely change in monetary policy by talking about tapering the level of bond purchases it makes each month. Bond purchases are a part of Quantitative Easing (QE) program used by the Fed to stimulate money flow and economic activity.
- Tapering reduces the amount of total assets owned by the Central Bank and aims to slow the money flow and change the direction of interest rates. Higher rates generally reduce the value of current bonds held in investors’ portfolios.
- Interest rates on the 10-year Treasury Bond rose in late September to over 1.50% from below 1.20% less than two months ago. The average yield on the 10-year Treasury Bond was 3.03% over the last 20 years (since September 2001).
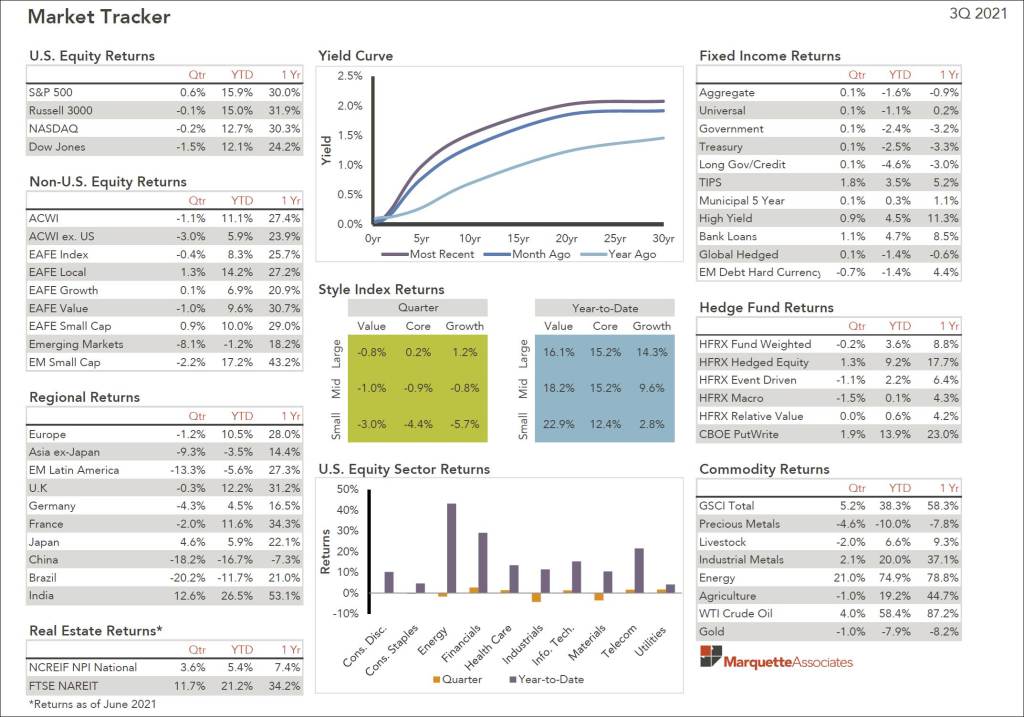
- Fixed income returns were flat in the third quarter and are negative in most categories year-to-date. (See the market tracker below.)
Equity
- Volatility returned in September, as investors considered weaker economic data and negative headlines surrounding China’s property sector. The Chinese government warned that the default of the countries’ second largest real estate developer, Evergrande, could create a ‘possible storm’.
- The S&P 500 finished September down 4.8% for its worst month since March 2020, when the pandemic caused a major market sell-off. The index closed the month below its record high for the first time this year.
- The European stocks benchmark ended September with losses of 3.4% after a seven-month winning streak, as a surge in government bond yields drove investors out of high-growth sectors such as technology into economically sensitive banking and energy stocks.
- Ongoing supply chain bottlenecks and concerns surrounding global economic growth and the COVID-19 delta variant have contributed to recent sell-off of equity holdings.
- Oil prices increased from $62 to $79 per barrel over the last month and natural gas prices in Europe set a record high as temperatures in the northern hemisphere start to get colder.
This communication was prepared for informational purposes only and is not an offer to buy or sell or a solicitation of an offer to buy or sell any security/instrument or to participate in any trading strategy. Past performance is not indicative of future results.