
U.S. Economic and Market Highlights
THE ECONOMY
- Real gross domestic product (GDP) in the U.S., E.U., and Asia varied in the third quarter.
| GDP growth rates in 3Q-2023 | U.S. 4.9% | E.U. -0.1% | Asia 3.9% est. |
o The different growth rates reflect the economic reality in these regions. U.S. saw increased consumer spending and inventory investment in the third quarter, but with higher interest rate pressures the economic activity is starting to show signs of a slowdown.
o The E.U. continues to experience the fall out of the war in Ukraine as gas prices remain high (although lower than previous months), supply chain uncertainties persist, and the inflation rate declines slowly as negative economic growth continues in many E.U. countries.
o Growth rates in Asia vary among countries, while slower growth in China influences the region.
- Central Bank representatives in the U.S., E.U., and Asian countries are generally holding steady on interest rates in the near future, with a likely next move of loosening/lowering short-term interest rates as inflationary pressures continue to subside.
- Inflation data for October in the U.S. was reported at 3.2% indicating a continual decline from previous months with some uncertainty about energy prices remaining as the northern hemisphere approaches the winter season amid heightened geopolitical risks.
- Commercial real estate investment trends shown in the chart below illustrate shifting percentages in the types of properties that make up the benchmark. Most affected sub-sectors are a declining interest in office space and increased interest in industrial and warehouse properties because of work-from-home and online shopping phenomena respectively.

FIXED INCOME
- U.S. Treasury returns are up 2.6% so far in November, biggest advance since March ending a six-month losing streak as investors’ expectations have moved toward the Federal Reserve being done raising interest rates. The 10-year Treasury yield declined more than 50 basis points in the past two weeks, reversing the trend that ended in October.
- Last month, the yield on the 10-Year U.S. Treasury Note and other sovereign government long-term bond yields rose to the highest level in 15 years in late October as investors expected interest rates to remain higher for longer.
- Mortgage-backed securities, which are more sensitive than other fixed income investments to interest rate changes, underperformed in the third quarter amid rising volatility. The average 30-year mortgage rate rose to 7.41%, its highest point since 2000. U.S. home prices remain near record highs as low supply and elevated borrowing costs have driven home affordability to the worst levels since the 1980’s.
- Commercial banks have imposed tougher lending criteria for commercial and industrial loans. The result of higher long-term rates and fewer loan originations is likely to mean an end to Federal Reserve interest rate hikes.
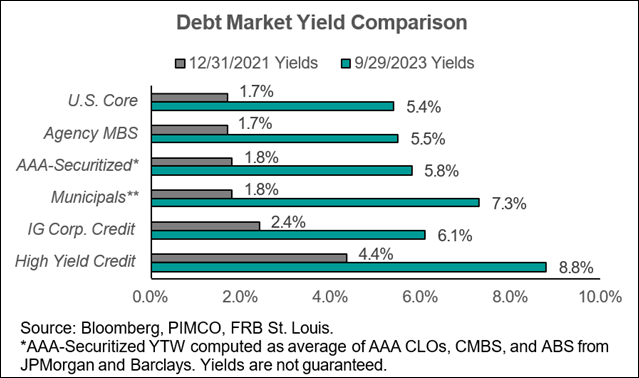
- With higher yields on fixed income investments, bonds and savings accounts offer significant value to support total yields earned in a portfolio.
- Yield to Worst (YTW) is a financial metric that helps investors assess the minimum yield they can expect from a fixed income investment under various scenarios. The YTW rates are currently in the mid-to-high single digit ranges across fixed income categories in the U.S., slightly lower in other developed markets, and slightly higher in emerging markets.
EQUITIES
- Stocks rally so far in November, as inflation falls. The rally follows better than expected inflation reports, leading analysts and portfolio managers to expect further gains heading into year-end, as concerns about rising bond yields and their impact on economic activity wane.
- The last couple of months through October 31, the equity markets were mostly negative. Year-to-date returns are mostly positive with a tilt toward growth companies, such as technology and communications. (See Market Tracker below.)
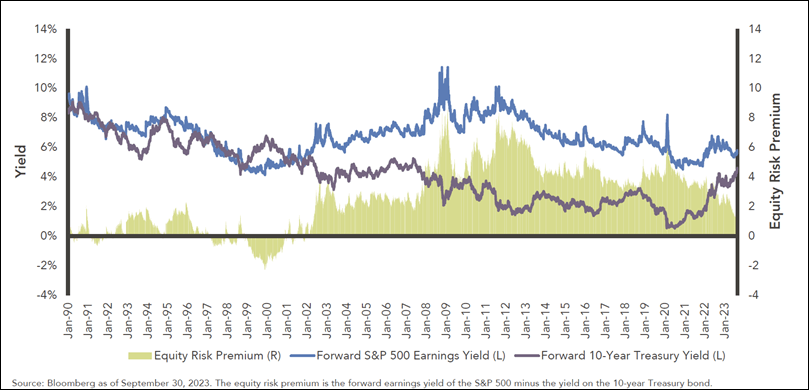
- With higher interest rates, the expected return from risk-free fixed income investment versus the expected return from equity investments (stocks) continues to narrow. This metric is called the equity risk premium. In the third quarter, the equity risk premium (difference between expected returns from stocks and bonds) reached its lowest level since 2002.
- Small company stocks globally have underperformed long-term averages over the last decade and therefore have relatively low prices compared to larger companies. The price-earnings (P/E) ratios for small companies are near historic lows.
- Central banks increased their gold purchases in the third quarter due to higher buying from China, Poland, Turkey, and India. Precious metals rose 6.3% in October, one of the only positive asset classes in the month. The outlook for the price of gold was revised upward upon the outbreak of the Israel-Hamas conflict. The price of gold per troy ounce rose to $2,000 for the first time since May 2023.

This communication was prepared for informational purposes only and is not an offer to buy or sell or a solicitation of an offer to buy or sell any security/instrument or to participate in any trading strategy. Past performance is not indicative of future results. See below reference sources used in preparing the above information.
